SMEs also need to know their market environment in order to be able to respond as accurately as possible to technological and market changes, as well as competitors. This information is, to a large extent, only available outside of the company and includes market observations and analyses, as well as competitor observation and analysis. This allows new competitors and new market segments and trends to be identified. However, these are usually only first perceived when they are already prominently present on the market. Ideally, such market developments should be able to be identified at an earlier stage, i.e. before market entry, which is where information from patent specifications comes into play.
For IP professionals
This is the portal for professionals working in the field of intellectual property. Here you'll find direct access to all necessary resources.
Quick links
Recognising trends early – How patent data benefits SMEs
SMEs are increasingly relying on business intelligence, i.e. the evaluation and use of their own business data, usually with the help of software solutions. The aim of this is to use the findings to support decisions in marketing and management.

Photo by John Schnobrich, unsplash.com
Patent documents as a source of information – the trend seismograph
Published patent specifications are full of valuable information. Patent intelligence uses these patent libraries. An SME can use the knowledge gained from this information to assist in making decisions on strategic management. The requirements for these libraries are laid down in international agreements and national patent laws. In particular, the disclosure obligation defined in such agreements allows insights into technologies and business strategies 18 months after filing a patent application. This is information that normally can’t be perceived on the market at an early stage. Patent data is collected worldwide, processed according to standardised information in identical specialised databases, then made available to the public worldwide. These libraries of over 120 million documents therefore contain valuable technology and business data.
How is a patent evaluated?
For decades, attempts were made to assign an absolute monetary value to individual patents by means of complicated calculations. Although this may have been possible in individual cases, it was more difficult for entire portfolios. Therefore, an attempt was made to generate a relative value that evaluates the patent in relation to other patents in the same technology field. Such approaches were for a long time promising, yet not convincing.
However, the latest developments in analysis tools and new qualitative indicators now make it possible to highlight the following information: technology trends, main areas of innovation within companies, industries and countries, technology leaders and their intellectual property (IP) strategies, technological positioning of companies and their changes over time, strengths and weaknesses of patent portfolios, competitors’ preferred markets, and much more. These qualitative, relative evaluations today provide accurate and meaningful results.
Extracting relevant business information
Analysing market behaviour on the basis of patents requires the clearest possible definition of the technology field to be examined, and sometimes of a specific geographical region or company (including all of its subsidiaries). To meet these requirements, a basic set of patents has to be compiled from the databases using a quantity sufficiently large enough to be able to make statistically relevant statements – in other words, at least several thousand.
The aim here is not, however, to analyse individual patents in detail, but to develop a basic set of relevant patent documents. This is usually the most complex step in the analysis. The basic set of patent documents can then be used to present trends and facts, i.e. answers can be found in graphs or in tables.
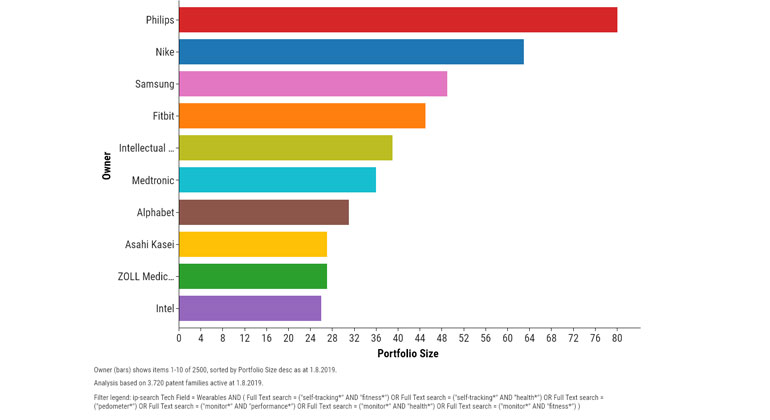
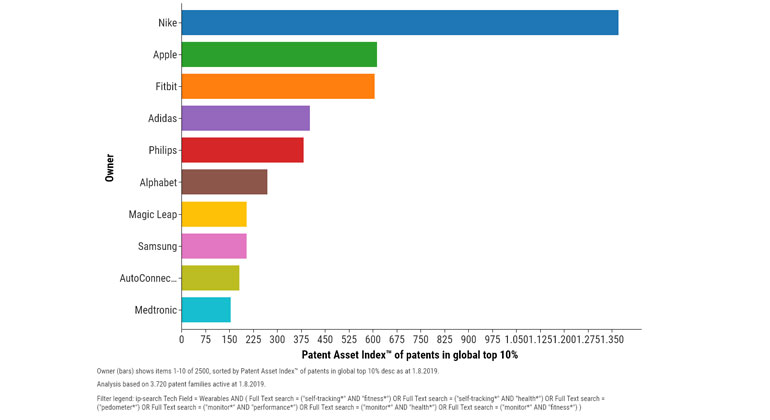
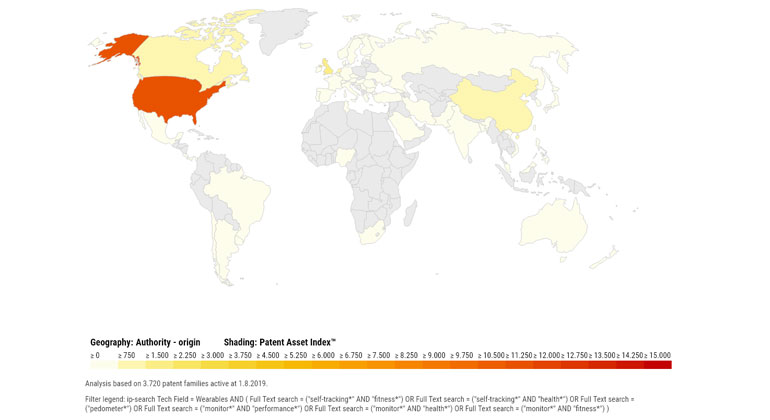
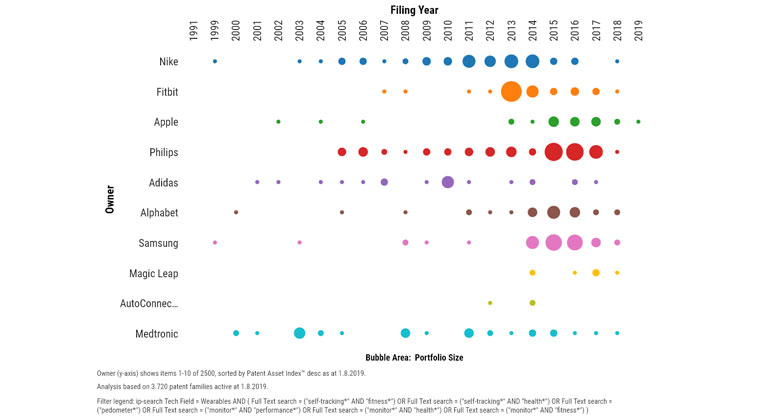
Self-tracking wearables
A strategic patent analysis of self-tracking wearables can be used to show how patent data can be processed. Whether a fitness app, a fitness tracker or a pedometer, self-tracking has become both a trend and an important market. The self-tracking wearable graphs shown here are only intended as an example of a possible analysis; they are not an in-depth analysis of this technology field. For this specific case, the composition of the basic set would have to be defined more precisely. In this analysis, however, the basic set consists of 3,720 active patent families. A family includes all patents from around the world for the same invention and from the same applicant. A single patent family represents an invention, no matter how many patent specifications the family consists of. Counting the patent families, therefore, does not correspond to counting the patents, but to counting the protected inventions.
These are only some of the possibilities of analysing and portraying a technology field and competitors – and/or your own company – with the help of patent data. All data was compiled and displayed with the software Patentsight.
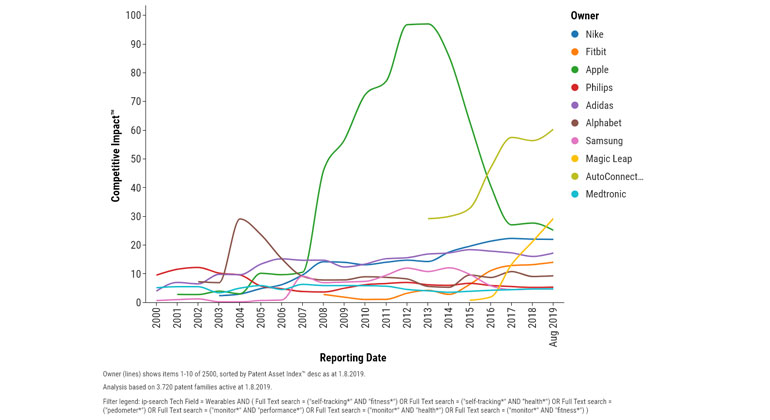
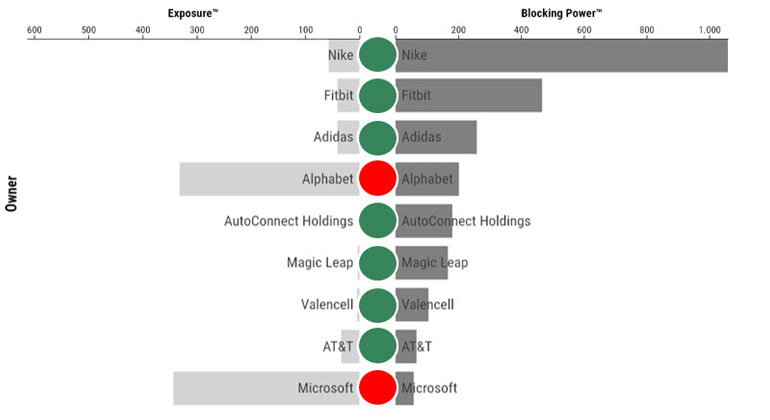
The next graphic shows the power and possibility that other companies have to block Apple. This means that a company may have (key) patents in its portfolio that could prevent Apple from bringing its innovations to market. Conversely, Apple’s patents could inhibit other companies from entering the market (exposure, vulnerability). This is measured by the number of citations of competitors' patents in Apple’s patents (blocking of Apple by others, exposure) and the citation of Apple’s patents in others' patents (contestability/exposure of others to Apple). Here, it is shown that Nike and Fitbit are currently Apple’s big competitors (large possibility of blocking Apple with patents) and on the other hand, that Alphabet and Microsoft are very volatile compared to Apple’s portfolio.
Services of the Swiss Federal Institute of Intellectual Property (IPI)
As part of its federal mandate, the IPI offers searches in patent databases. The Assisted Patent Search lasts for half a day and costs 300 Swiss francs. The aim of such a search is, together with a patent expert, to find those patent specifications that come close to the client’s own invention in a database containing more than 100 million patent documents. This allows the novelty of one's own invention to be assessed.
Business data can also be compiled as described previously in this article. This service is also offered by the IPI for SMEs that have funding from a promotor of research and innovation and with whom the IPI has concluded a framework agreement. This Assisted Patent Landscape Analysis also costs 300 Swiss francs.
These analyses are limited to specific evaluations and graphics. Various providers of search services offer more in-depth search and analysis services, including the IPI under the label ip-search.
Explanation of terms
Competitive impact:
This value is calculated as follows:
- The technology relevance measured by the number of citations
- Weighted according to the age of the patent and the issuing authority of the citations
- Multiplied by the market coverage, i.e. the number of markets covered weighted by size and importance.
Patent Asset Index:
The sum of all competitive impacts in a portfolio
World-class patents:
Number of patents in a portfolio which belong to the best 10% worldwide (Competitive impact)